The One Trade For Life Setup
Here’s Why:
Forms after an uptrend or strong bullish move.
The candle has a small real body near the low and a long upper wick, showing price was pushed up but rejected hard.
Buyers tried to continue the rally, but sellers took control and pushed the price back down
This wick signals rejection at higher levels and hesitation from bulls.
What It Indicates:
A potential bearish reversal.
Momentum may be shifting from buyers to sellers.
Traders often look for confirmation on the next candle(e.g., a red candle closing lower) before acting.
Commonly used as an early warning to tighten stops or look for short entries.
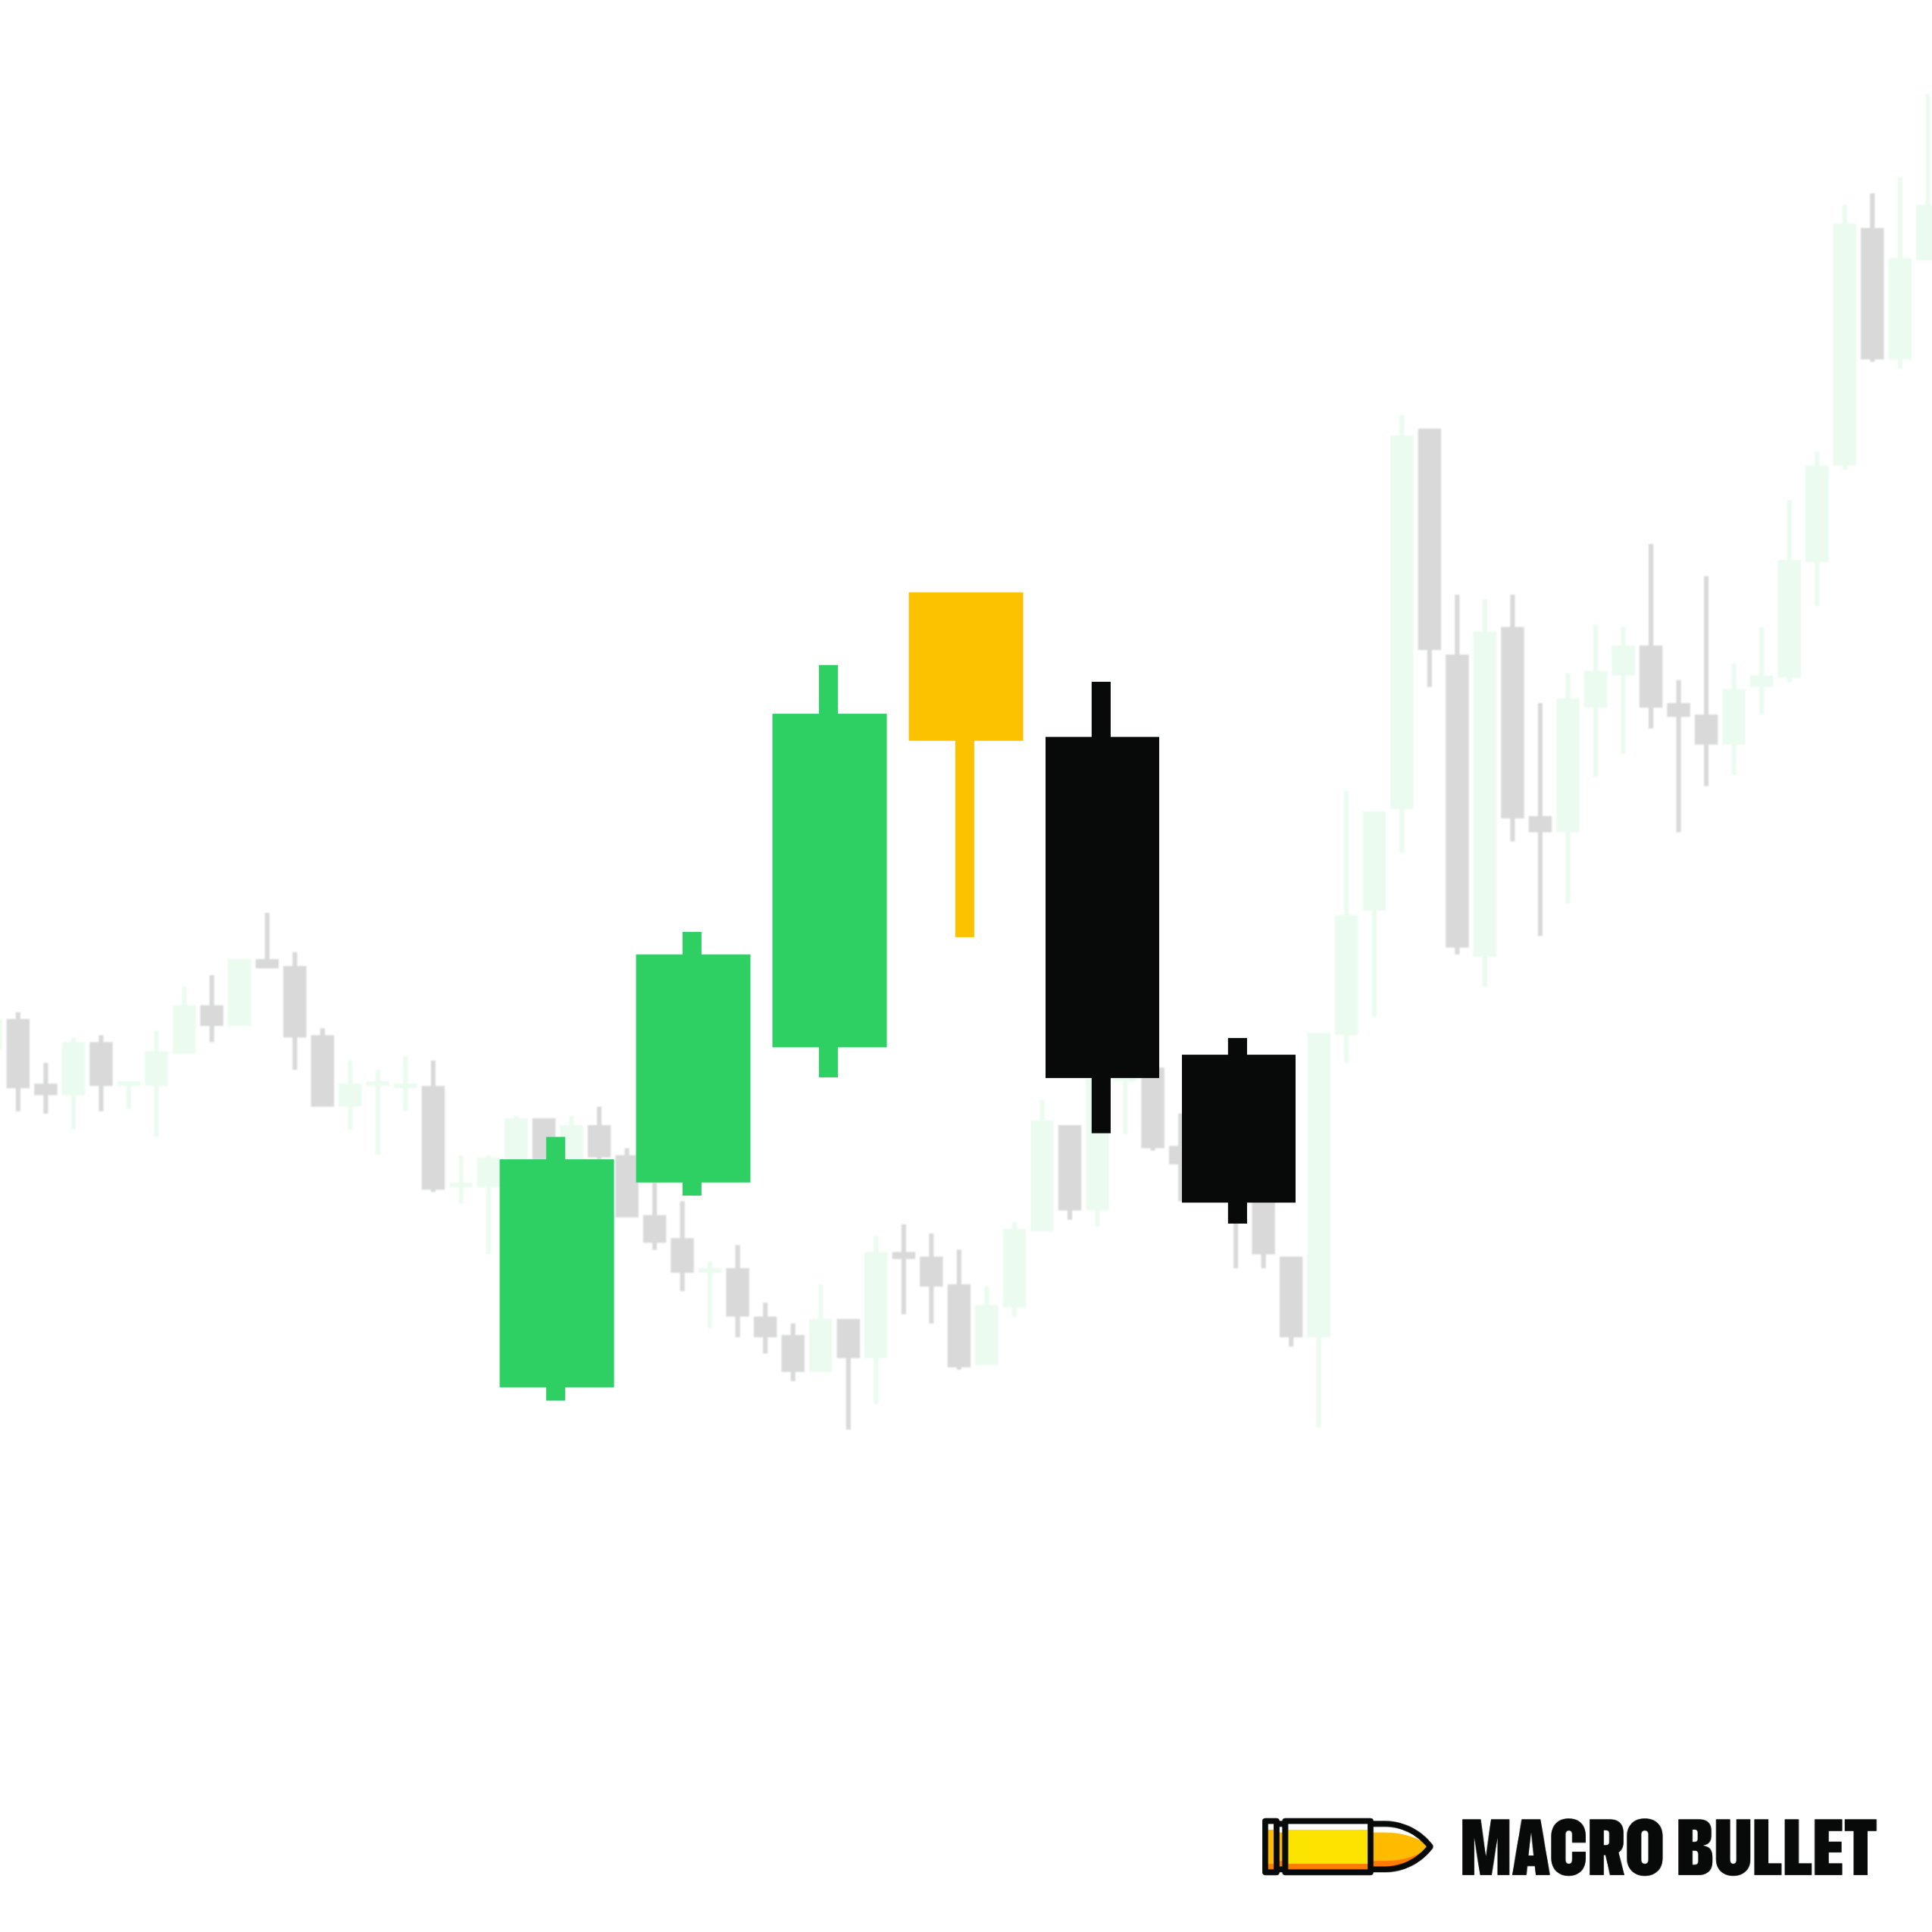
Here’s Why:
Forms after an uptrend or strong bullish move.
The candle has a small real body near the top and a long lower wick, with little or no upper shadow.
Shows that sellers entered the session aggressively, pushing price down, but buyers managed to close it back near the open.
Despite the recovery, the long lower shadow reveals weakness in bullish momentum.
What It Indicates:
A potential bearish reversal.
Suggests buying pressure is fading and sellers are gaining strength.
Traders often look for confirmation from the next candle (like a strong red close) to validate the pattern.
It’s a warning sign that the uptrend could be ending.
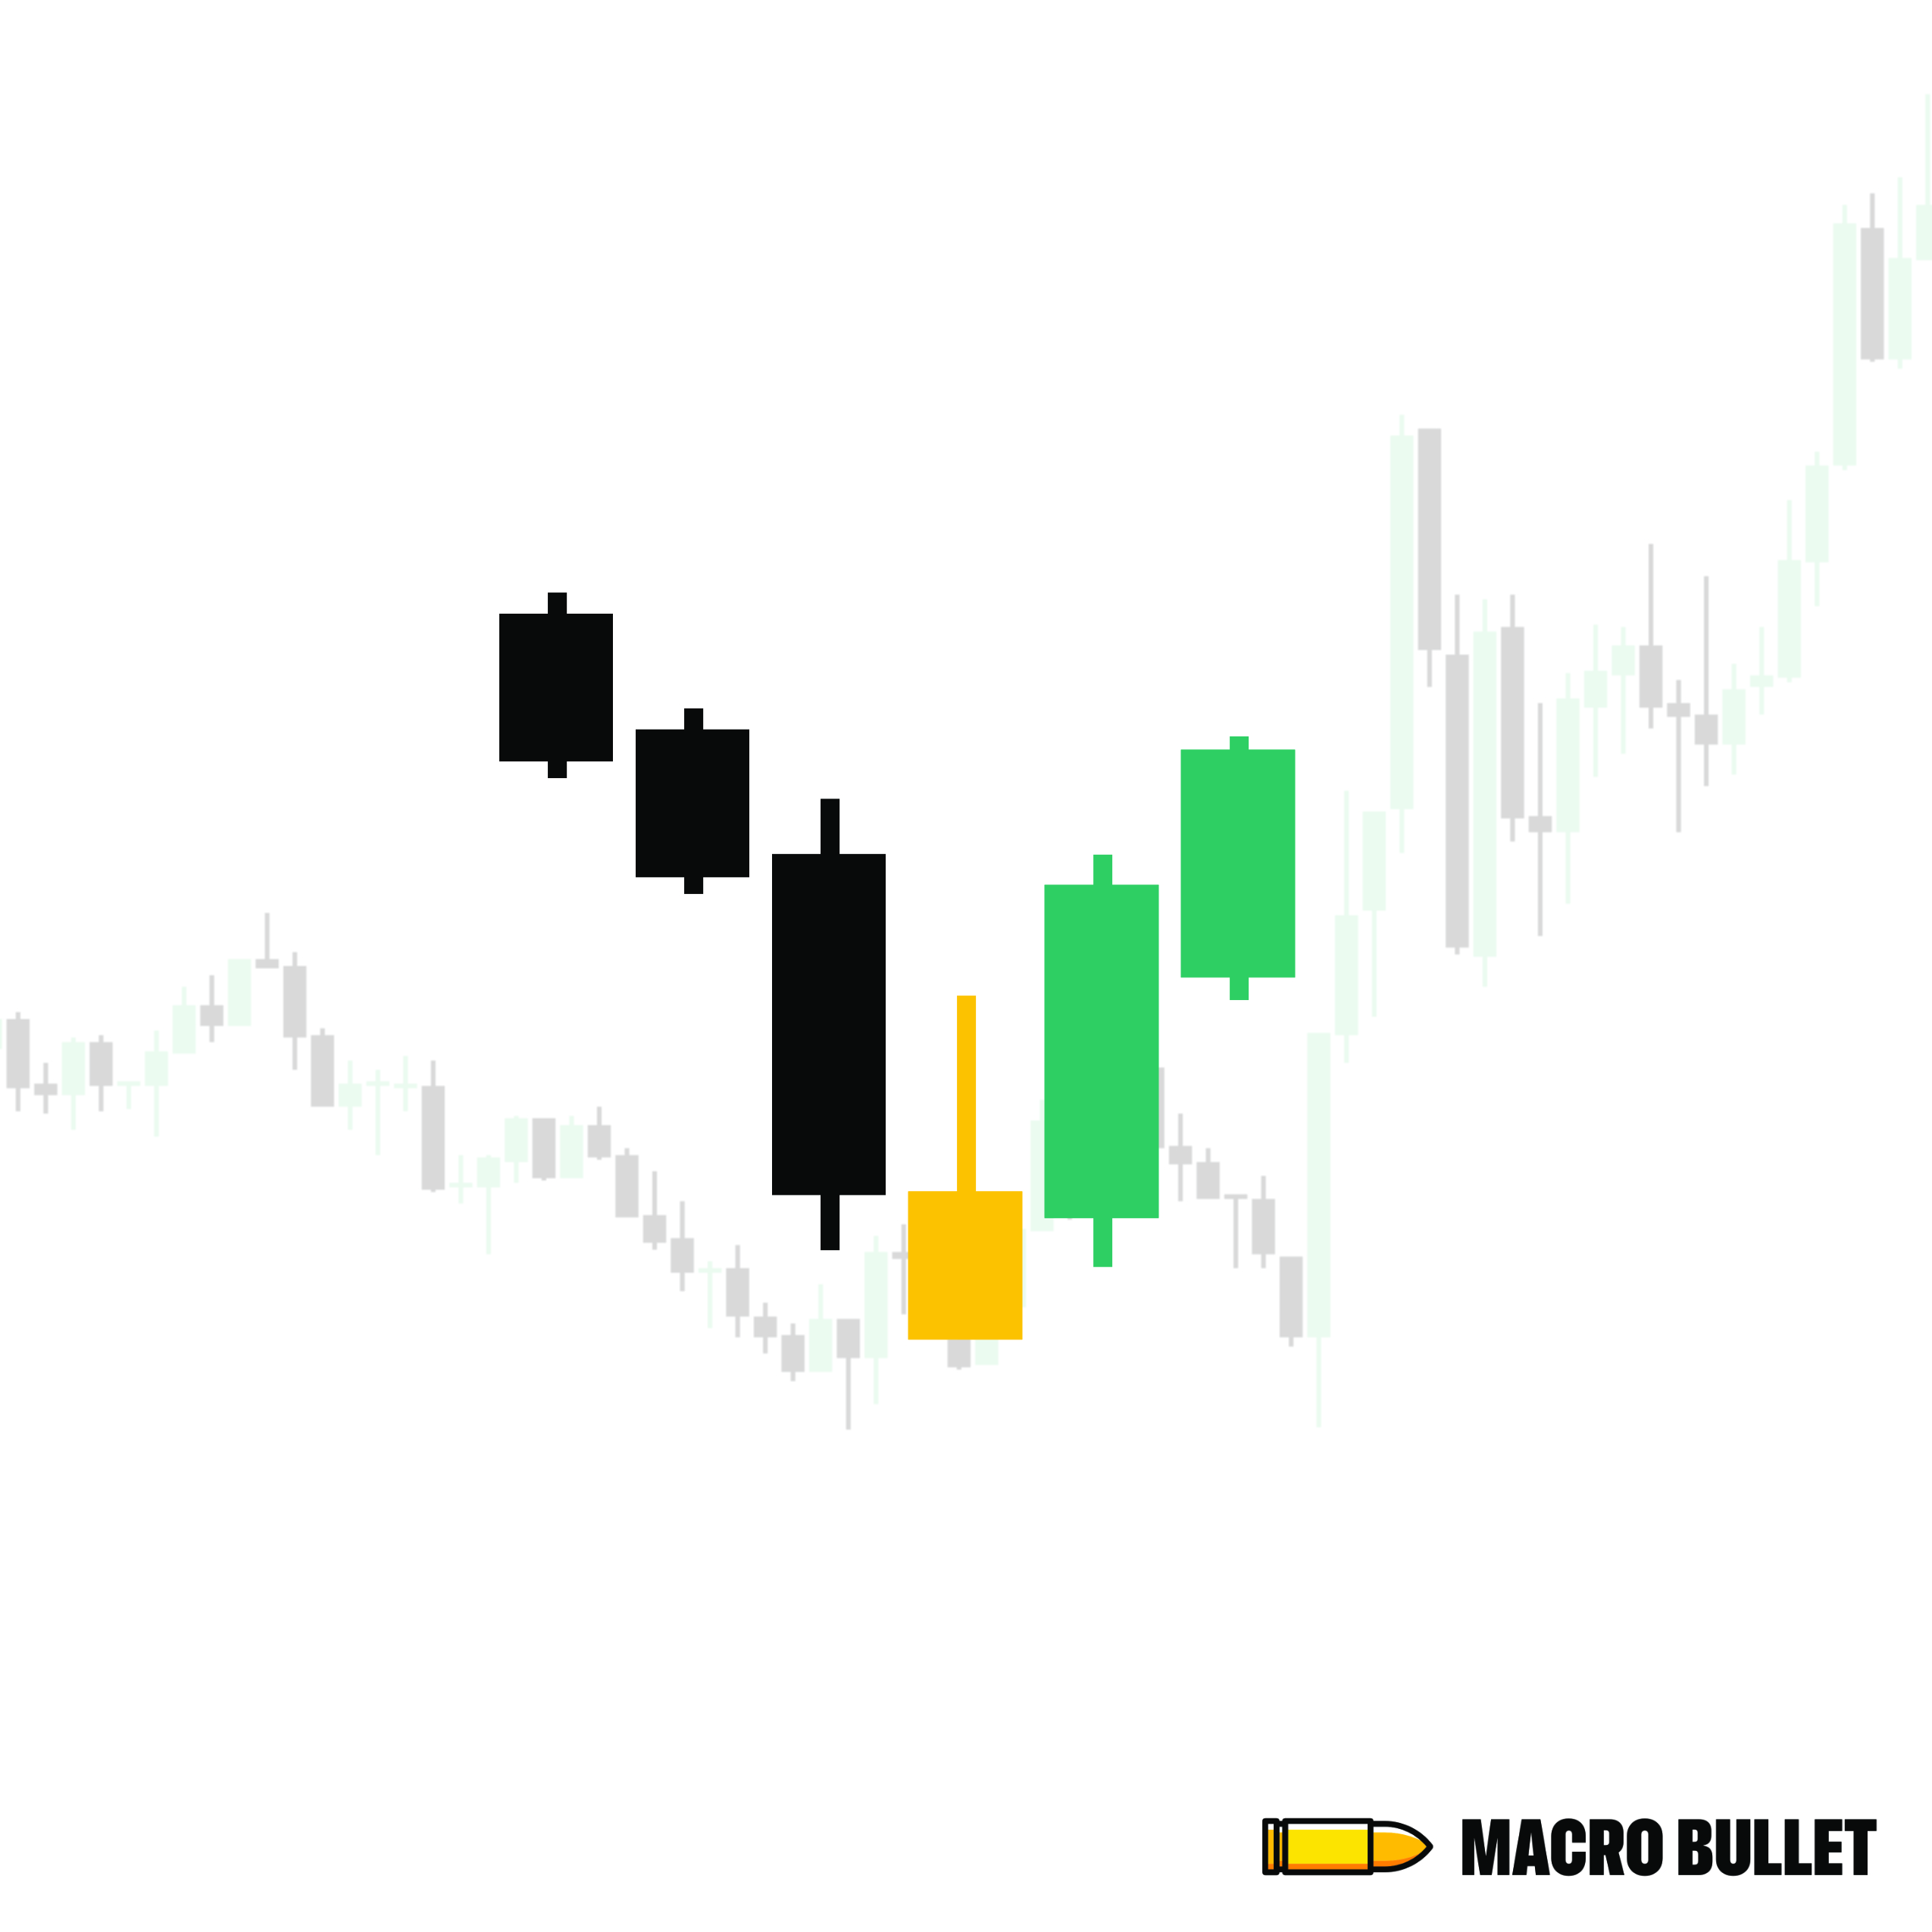
Here’s Why:
Forms after a downtrend or bearish move.
The candle has a small real body near the top and a long lower wick , with little or no upper shadow.
The long lower wick shows sellers tried to push the price lower, but buyers fought back and closed near the high.
This shows a shift in control from sellers to buyers.
What It Indicates:
A potential bullish reversal.
Signals that downward momentum may be weakening , and buyers are stepping in.
Traders look for confirmation (like a strong green candle next) to validate the reversal.
Often used as an early entry point in a trend change to the upside.
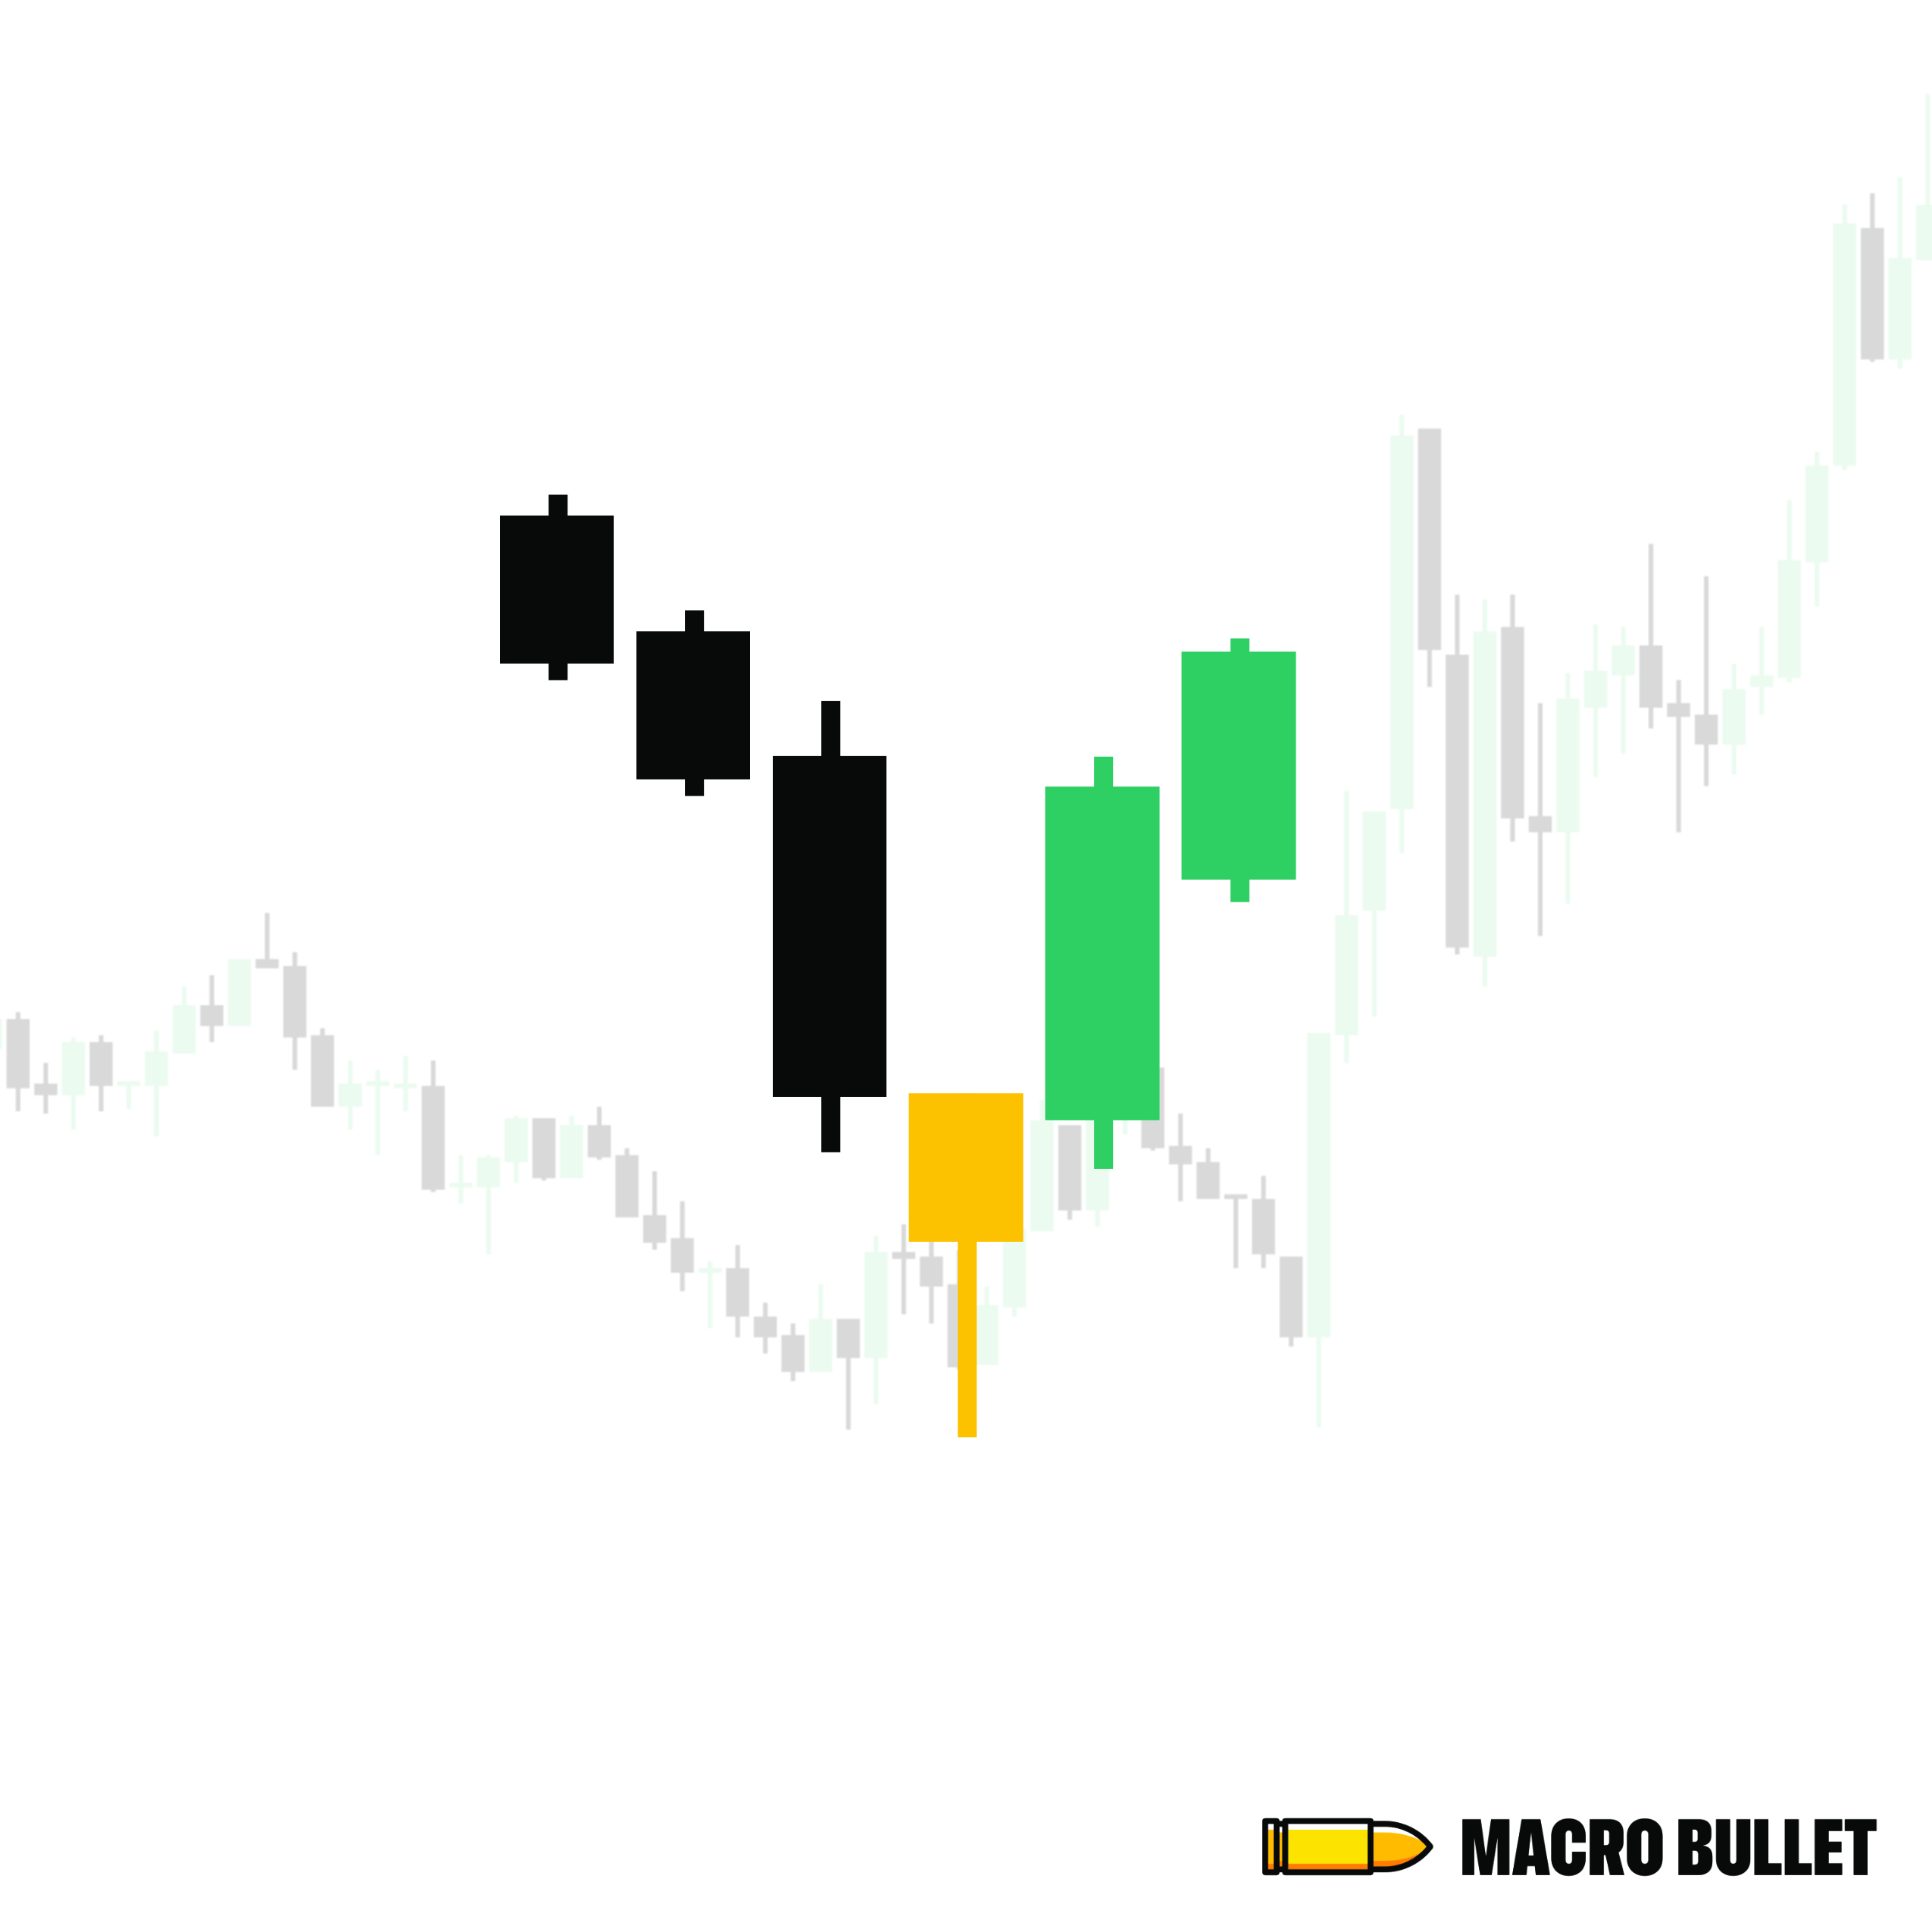
Here’s Why:
Appears after a downtrend or strong bearish move.
The candle has a small real body near the bottom and a long upper wick, with little or no lower shadow.
Shows that buyers tried to push price up, but sellers brought it back down slightly — however, buyers still held ground.
The long upper wick signals early buying interest even if the session closed lower.
What It Indicates:
A potential bullish reversal.
Suggests buyers are starting to test control, even if they haven’t fully taken over yet.
Traders typically wait for confirmation on the next candle — like a strong bullish close — before entering.
It’s often seen as a warning sign that the downtrend may be losing steam.
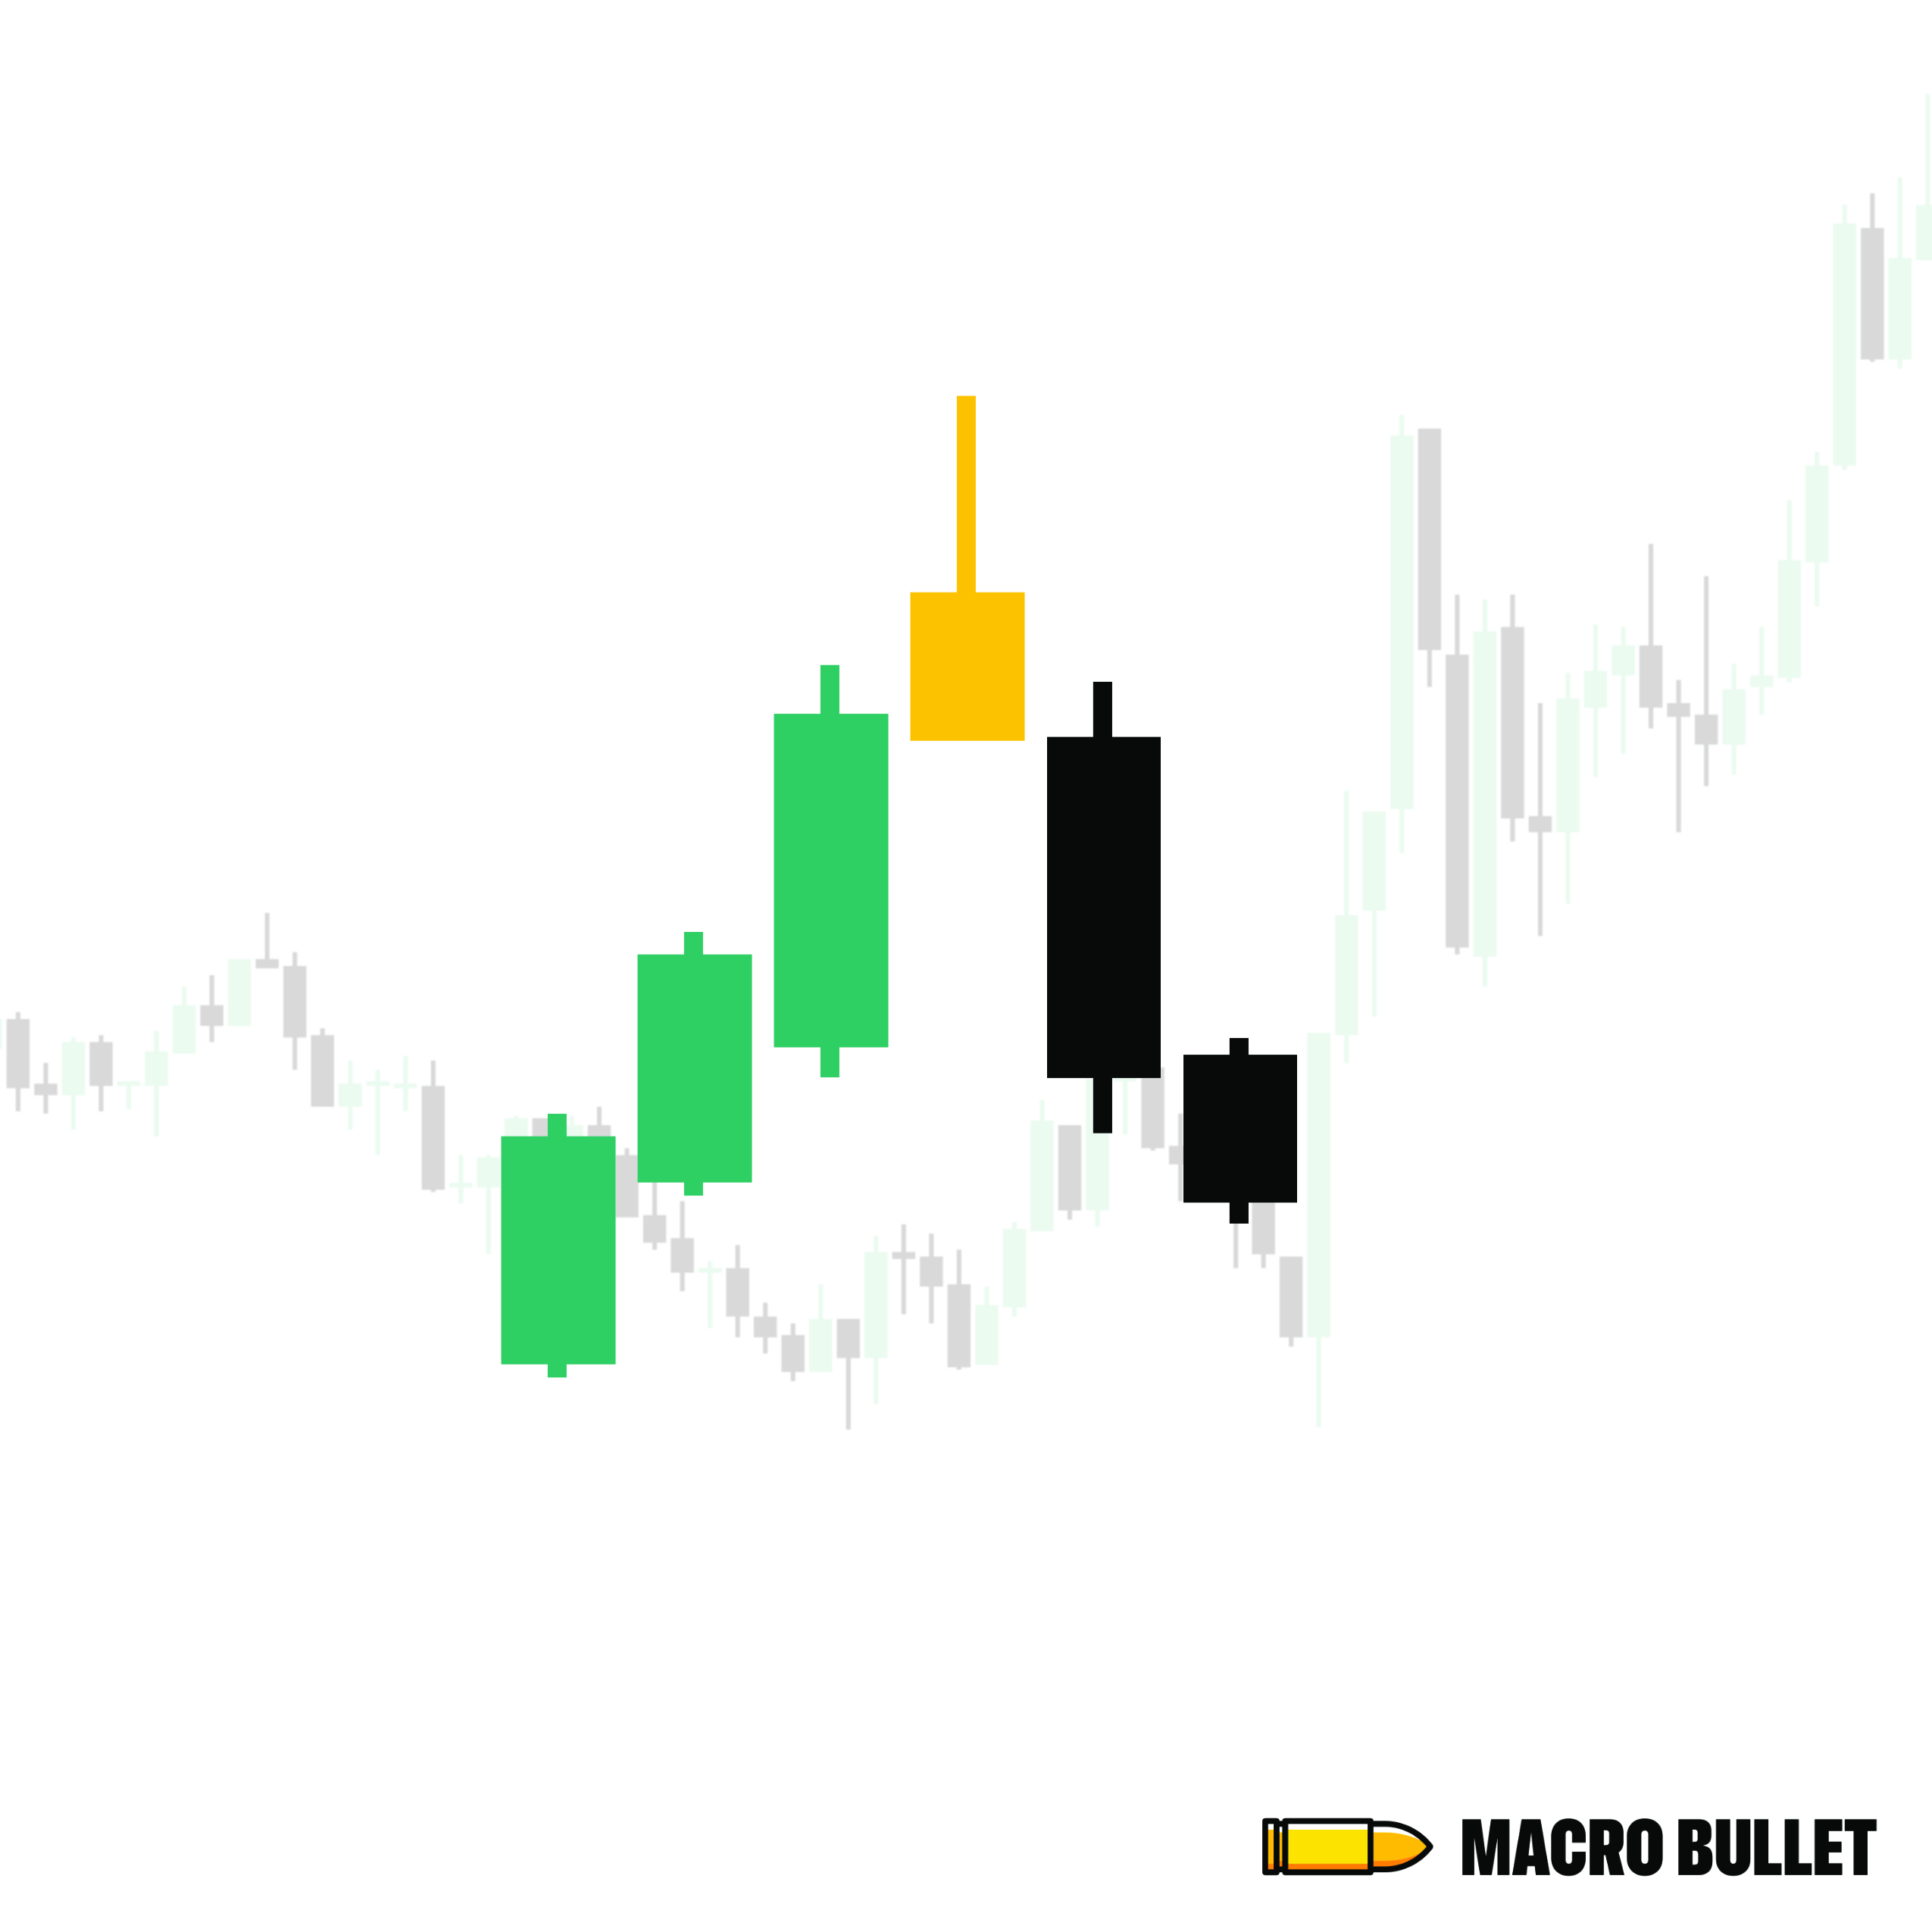
Here’s Why:
A strong two-candle pattern forms where the second candle’s body fully engulfs the body of the first.
This shift shows that the previous trend is weakening, and momentum is flipping.
In a Bullish Engulfing, a small red candle is followed by a large green candle that engulfs it — signaling buyers have stepped in forcefully.
In a Bearish Engulfing, a small green candle is followed by a large red candle that engulfs it — showing sellers have taken control.
This often happens at the end of a trend, hinting at exhaustion and a reversal.
What It Indicates
A possible reversal in the current trend.
Signals a strong shift in sentiment, either from bearish to bullish or bullish to bearish.
Traders use it to spot momentum changes and may enter in the direction of the engulfing candle, often placing stop losses beyond the engulfing candle’s high or low.
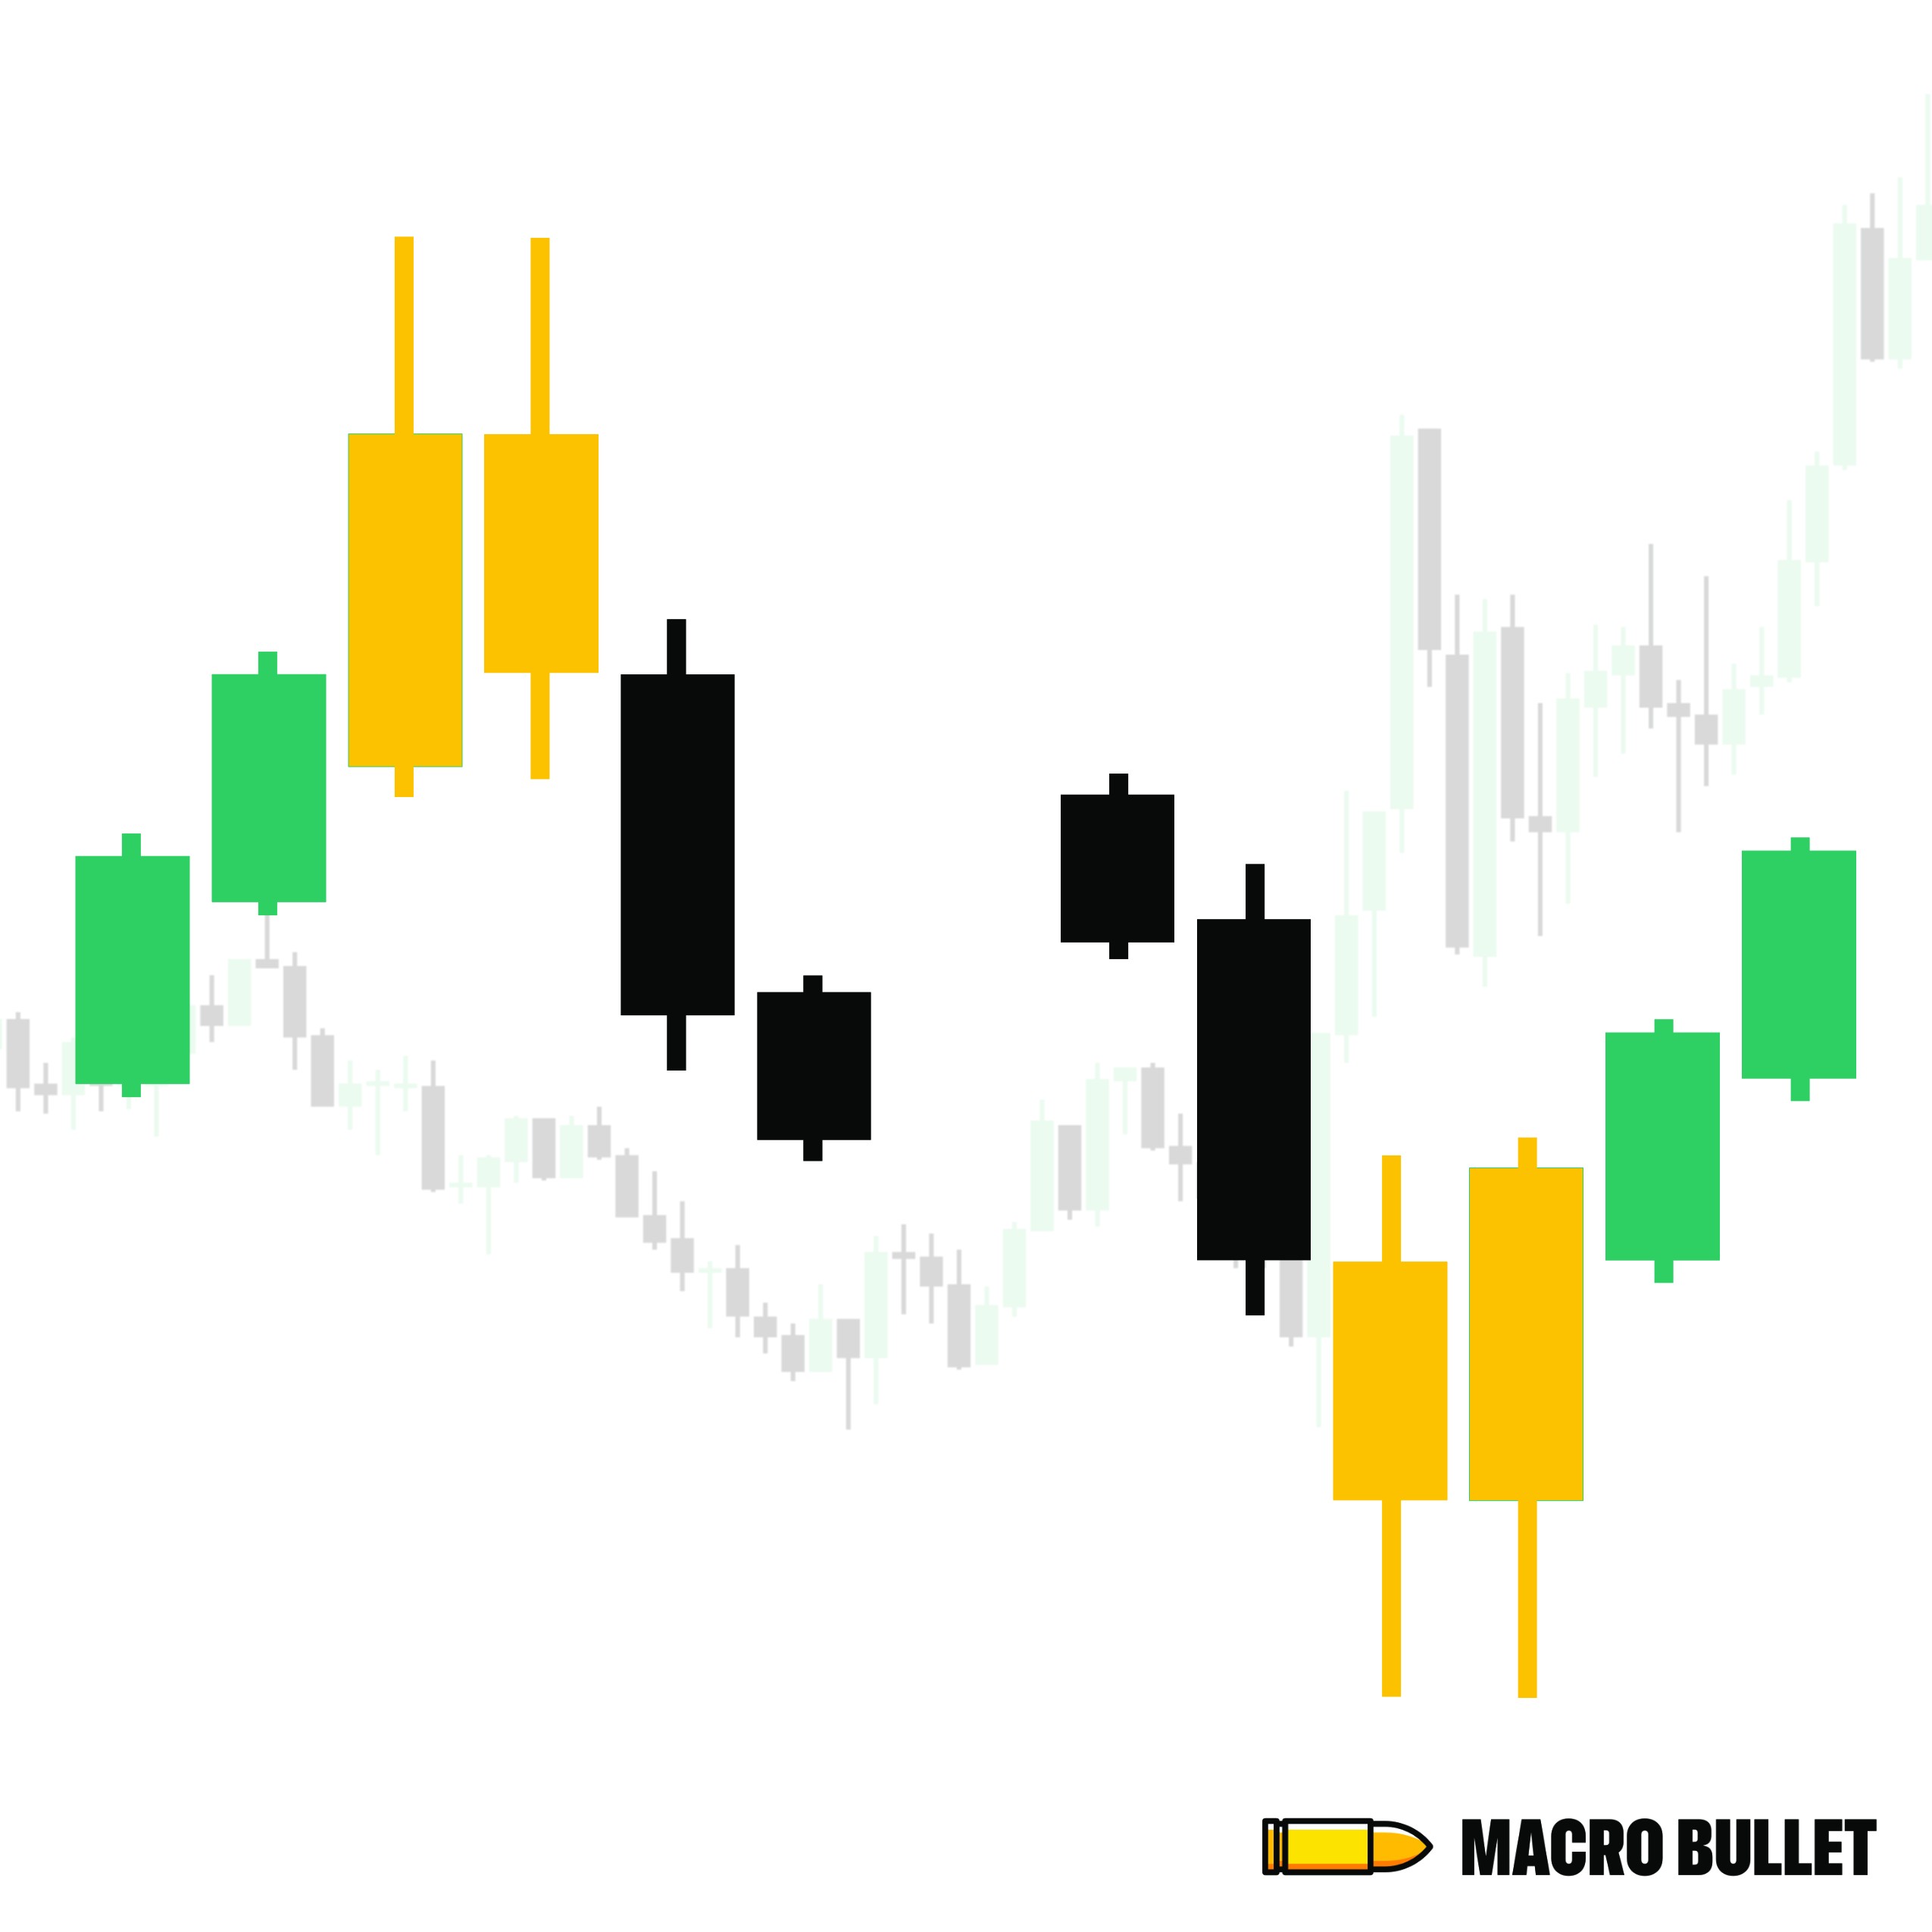
Here’s Why:
A two-candle pattern where the second candle’s body is fully contained within the body of the first — like a “baby” candle inside a “parent” candle.
In a Bullish Harami, a large red candle is followed by a small green candle, signaling that selling pressure has weakened and buyers are stepping in cautiously.
In a Bearish Harami, a large green candle is followed by a small red candle, suggesting bullish momentum is fading and sellers may regain control.
This formation often appears after a strong trend and represents indecision or potential reversal.
What It Indicates
A pause or shift in trend direction — often the early sign of a reversal.
It reflects market hesitation, where the dominant force (buyers or sellers) is losing strength.
Traders use Haramis to anticipate reversals with tighter risk setups, often placing stop losses beyond the range of the larger candle.
Here’s Why:
Two consecutive candlesticks appear with matching highs or matching lows, forming a visual “tweezer” shape.
The second candle often rejects the same price level as the first, showing hesitation or reversal at a key level.
The pattern typically occurs at the end of a strong trend—either up or down—signaling exhaustion of momentum.
The identical highs or lows suggest that buyers or sellers failed to push past a critical level twice in a row.
What It Indicates
A potential reversal in the current trend.
It shows a shift in market sentiment—from bullish to bearish or vice versa.
Traders often use it to identify turning points and may enter a trade in the opposite direction of the current trend, placing stop losses just beyond the tweezer highs or lows.